Orthopedic implants must survive repeated loading, not just one impressive laboratory pull. Every stair, stride, and chair transfer can create another stress cycle. The World Health Organization reports that musculoskeletal conditions affect approximately 1.71 billion people worldwide. That scale makes implant durability a clinical priority, not merely an engineering preference. It also raises a practical question: Why do orthopedic implants need fatigue resistance testing? A device may appear strong after static loading, yet develop microscopic cracks after millions of cycles.
Fatigue testing recreates demanding conditions with controlled force, frequency, alignment, and environmental exposure. Hip stems, knee components, spinal cages, and fixation plates require different test approaches. ISO 7206 addresses fatigue testing for hip joint prostheses, while ASTM F2077 evaluates intervertebral body fusion devices. ASTM F1717 further examines spinal implant constructs under severe laboratory loading. These standards help laboratories compare performance using traceable methods. They do not predict every patient outcome.
Clinical evidence matters too. The American Joint Replacement Registry’s annual reports track millions of hip and knee procedures, revealing how revision risk changes across implant types, patient groups, and follow-up periods. FDA guidance also emphasizes risk-based evaluation, manufacturing controls, and post-market surveillance for orthopedic devices. Together, these sources support a broader view of reliability. A polished test graph is not proof of lifelong success. Real bodies vary. Real loading is messy. Engineers should question fixture alignment, material defects, corrosion, and test duration. The strongest fatigue program combines standards, realistic worst-case conditions, validated equipment, and transparent interpretation. Small weaknesses deserve attention before they become clinical failures.
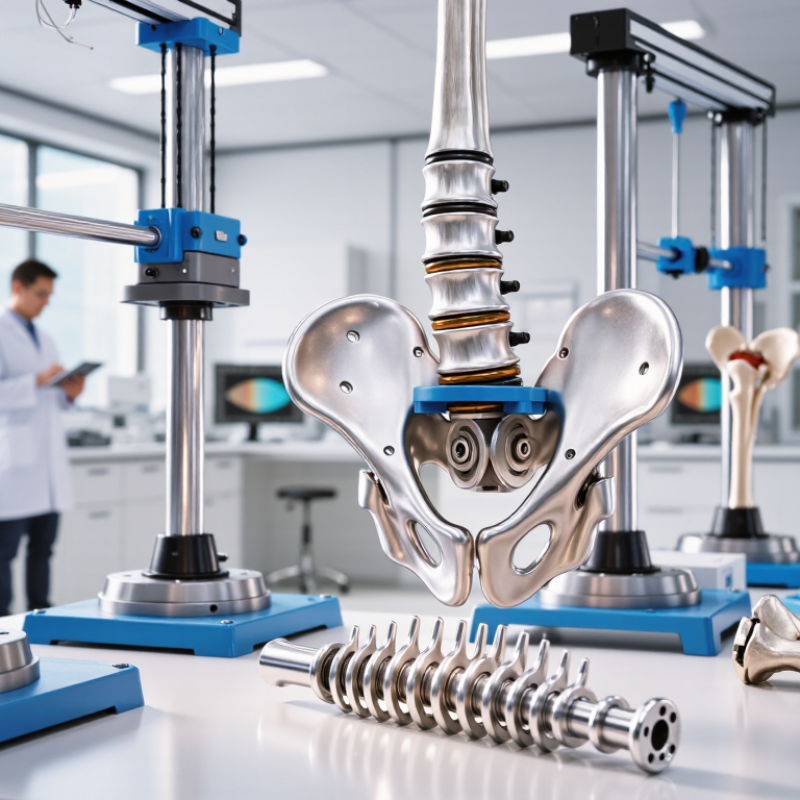
Fatigue resistance describes an orthopedic implant’s ability to endure repeated loading without cracking, breaking, or deforming. The load may come from walking, climbing stairs, or lifting the body. A single heavy force is not the main concern. Repetition is.
In laboratory practice, engineers place the implant in a fixture that reflects its intended anatomical position. They apply controlled cycles through a bone-like support or validated test assembly. Test conditions often include body-temperature saline, realistic alignment, and clinically relevant loading. Sensors record displacement and stiffness during the test. A sudden change may indicate loosening or damage. Inspectors then examine the implant for cracks, fretting, and permanent deformation.
The results help define how many cycles the implant can survive at a specific load. An S-N curve can show this relationship across several load levels. Some tests continue until fracture. Others stop at a planned cycle count, called a runout. The definition must remain precise. Passing one million cycles does not mean the implant can never fail.
Patients do not move like machines. Their weight, bone quality, surgical positioning, and activity levels differ. Laboratory tests therefore provide controlled evidence, not a complete prediction of clinical performance. A sound assessment combines fatigue data with material characterization, design review, manufacturing inspection, and post-test analysis. Even small surface scratches deserve attention, because fatigue cracks may begin there. Limits should be reported clearly, including fixture assumptions, loading frequency, environmental conditions, and any unexpected test behavior.
Selecting the right test standard is the foundation of reliable orthopedic implant fatigue testing. The device type, fixation method, anatomical location, and expected failure mode should guide the choice. Standards such as ISO 7206 or relevant ASTM methods can provide a structured starting point. However, their scope must match the implant design and intended use.
Test engineers should reproduce physiological loading rather than apply a convenient laboratory force. Hip components may require cyclic compression, bending, and torsion. Spinal devices can experience combined axial loading and flexion-extension. Load levels should reflect documented patient activities, including walking, stair climbing, or accidental overload. A saline solution maintained near 37°C can better represent the body environment. Test frequency also deserves attention. Excessive cycling speed may create heating or unrealistic material behavior.
Test setup matters. Calibrated fixtures, alignment checks, and recorded displacement help expose small errors. Each specimen should receive a defined cycle count, load ratio, and acceptance criterion. Failure analysis should examine cracks, fretting, deformation, and fixation damage, not only final fracture.
No protocol is perfect. A standard may simplify real movement, while a physiological model may introduce uncertain assumptions. That limitation should be documented openly. Repeat testing, independent review, and comparison with prior evidence can make the results more trustworthy.
Fatigue testing starts before the test machine runs. Prepare each implant with documented dimensions, surface condition, mass, and production history. Inspect threads, porous areas, and polished transitions under magnification. Small scratches can become serious stress concentrators. Fixtures must hold the implant in a clinically realistic position. They should also prevent unwanted bending or rotation. A loose fixture can create a convincing lie.
Build the simulated body environment with purpose. Control temperature near 37°C, maintain a physiological fluid chemistry, and record pH, fluid volume, and replacement intervals. Use applicable ISO 7206 and ASTM F1800 methods for relevant implant types. FDA orthopedic testing guidance also supports worst-case configurations and clinically relevant loading. The 2024 National Joint Registry report records more than 3.5 million hip and knee procedures, showing why long-term performance evidence matters. Yet, laboratory confidence is not clinical proof. Our first fixture may look elegant but still over-constrain the implant. That deserves review.
Tips: Photograph every setup before cycling. Calibrate load cells and displacement sensors. Use sacrificial samples to check alignment. Start with a pilot run. Inspect wear debris and cracks at planned intervals, not only after failure. Record every deviation, even the embarrassing ones. A missing note today can weaken tomorrow’s conclusion.
Fatigue testing shows how an orthopedic implant may behave after thousands of repeated loads. Prepare specimens according to the applicable testing standard and document their dimensions, material, and surface condition. Apply cyclic loading that reflects realistic body forces, not only ideal laboratory values. Control frequency, load ratio, temperature, and alignment carefully. A small fixture error can change the result.
During testing, inspect the implant at scheduled intervals. Record displacement, stiffness, temperature, and changes in the load signal. Listen for unusual clicks. Watch for fretting marks, surface cracks, loosening, or permanent deformation. Digital imaging and microscopic examination can help locate crack initiation. Stop a specimen when fracture, severe migration, or unsafe instability appears. Then examine the fracture surface and compare it with the recorded cycle count. A clean dataset can still mislead if early warning signs were missed.
Tips: Calibrate sensors before every series. Use clear failure definitions. Test more than one loading condition. Keep detailed photographs and raw data. Do not treat one successful specimen as proof of reliability. No test model is perfect. Recheck assumptions when the results seem unusually consistent. Experienced reviewers should question fixture design, sample preparation, and whether the selected load truly represents clinical use.
| Implant or Construct | Typical Test Method | Specimen Count | Loading Mode | Representative Load Range | Load Ratio / Frequency | Target Cycles | Failure Monitoring | Typical Acceptance Outcome |
|---|---|---|---|---|---|---|---|---|
| Femoral Hip Stem | ISO 7206-4 | 6 specimens | Sinusoidal axial compression applied at the femoral head and distal support region | 300–2,300 N | R = 0.13; 15 Hz maximum when heating and fixture response remain controlled | 5,000,000 cycles | Visual inspection, permanent deformation measurement, crack detection, load-displacement trend, and post-test dimensional inspection | No fracture, visible crack, or unacceptable permanent deformation before the target cycle count |
| Knee Tibial Tray | ASTM F1800 | 6 specimens | Repeated vertical loading through the tibial insert contact area with support under the tray | Maximum load selected from the approved knee-loading profile; commonly reported values are approximately 1,000–2,500 N | R = 0.10–0.20; 5 Hz or lower when required to limit specimen heating | 10,000,000 cycles | Tray deflection, subsidence, insert displacement, crack initiation, fixture alignment, and periodic dye penetrant or magnified inspection | No tray fracture, separation, or deformation that compromises fixation or load transfer |
| Spinal Rod and Screw Construct | ASTM F1717 | 4–6 constructs | Four-point bending or construct-specific cyclic loading with the implant mounted in a standardized vertebral-block model | Load level established from the construct design; approximately 50–300 N is commonly used for comparative fatigue screening | R = 0.10; 5 Hz or lower for high-cycle testing | 5,000,000 cycles | Rod fracture, screw loosening, connector slippage, angular displacement, stiffness loss, and visible fretting at interfaces | No complete fracture or clinically significant loosening before the target cycle count |
| Bone Plate and Screw System | ASTM F382 | 5–6 plate constructs | Four-point bending with the plate supported across a defined span and loaded at the central region | Load selected to produce a controlled bending moment below the single-cycle yield level; commonly 100–600 N depending on plate geometry | R = 0.10; 2–10 Hz | 1,000,000 cycles or until failure | Plate crack growth, screw-hole deformation, screw migration, loss of stiffness, and permanent set after unloading | No fatigue fracture or unacceptable loss of construct stiffness at the specified cycle count |
| Intramedullary Nail | ASTM F1264 | 5–6 nails | Cyclic four-point bending or combined bending and compression using a bone-mimicking fixture | Approximately 300–1,500 N, adjusted for nail diameter, locking configuration, and intended anatomical location | R = 0.10–0.20; 2–5 Hz | 5,000,000 cycles | Nail curvature, locking-hole cracking, screw breakage, permanent deformation, stiffness reduction, and radiographic inspection | No nail or locking-screw fracture and no permanent deformation exceeding the predefined limit |
| Interbody Fusion Cage | ASTM F2077 | 6 specimens per loading mode | Cyclic axial compression and compression-shear loading between standardized vertebral endplate blocks | Approximately 200–2,000 N for compression; shear load defined separately according to the construct and test configuration | R = 0.10; 3–5 Hz | 5,000,000 cycles | Cage migration, subsidence, fracture, deformation, endplate indentation, load-displacement change, and post-test surface inspection | No structural fracture or migration beyond the predefined acceptance limit |
| Shoulder or Elbow Joint Component | Device-specific cyclic loading protocol based on applicable joint-replacement guidance | 5–6 specimens | Combined axial, bending, and torsional loading representing repeated joint motion | Approximately 500–2,000 N axial load with torsional or bending components defined by the joint design | R = 0.10–0.20; 1–5 Hz | 1,000,000–5,000,000 cycles | Component fracture, loosening, wear-related damage, deformation, torque change, and periodic dimensional checks | No structural failure, unacceptable loosening, or loss of functional alignment |
| Orthopedic Fixation Pin or Wire | ASTM F1541 or device-specific bending-fatigue protocol | 5–10 specimens | Repeated cantilever or three-point bending with the pin or wire secured in a standardized fixture | Approximately 20–250 N, depending on diameter, material, and unsupported length | R = 0.10; 5–20 Hz after confirming stable specimen temperature | 500,000–2,000,000 cycles | Crack initiation, fracture location, permanent bending, surface damage, and changes in load amplitude during cycling | No complete fracture or permanent deformation beyond the defined clinical limit |
After fatigue testing, raw cycle counts are only the beginning. Record the applied load, stress ratio, frequency, temperature, and specimen condition for every test. Confirm calibration records before interpreting the data. Small setup errors can distort performance.
Plot stress amplitude against cycles to failure on a logarithmic scale. Mark fractured specimens and run-outs separately. A smooth S-N trend is useful, but it can mislead. Examine stiffness loss, permanent deformation, and changes in displacement throughout the test. Photograph fracture surfaces and identify the origin, direction, and surrounding features. A crack near a connection may indicate a design issue, while damage at the gripping area may suggest fixture influence.
Report the failure definition clearly. State whether failure means complete fracture, visible cracking, excessive deformation, or a measured stiffness drop. Include specimen dimensions, material condition, loading alignment, test frequency, and environmental controls. Describe censored data and explain how run-outs were treated statistically. Confidence intervals are more informative than a single impressive cycle count. They show uncertainty.
A practical report should also compare results with the acceptance criteria and intended clinical loading. Avoid claiming unlimited durability from tests that ended early. Explain deviations, including interrupted tests or unusual temperature readings. One detail is easy to miss: preserve the original machine files. They allow independent review when the final graph looks too perfect. Recheck it.
Fatigue resistance is commonly evaluated by applying cyclic loading until failure or until a defined runout limit is reached. The chart presents representative anonymized laboratory results reported as maximum cyclic load and cycles completed under fatigue testing conditions consistent with orthopedic implant test practices.
Higher cycle counts indicate better fatigue endurance. Specimens that reached the 5,000,000-cycle runout limit without fracture are reported as “Runout.” Results should be interpreted together with specimen geometry, loading mode, stress ratio, test frequency, and failure location.
It means resisting repeated loads without cracking, breaking, or permanently deforming. Walking and stair climbing create repeated forces. Repetition matters.
Engineers secure the implant in a fixture matching its intended anatomical position. A bone-like support receives controlled loading cycles. Sensors track displacement and stiffness.
Testing may use body-temperature saline, clinical alignment, and relevant loading levels. Engineers should record frequency, stress ratio, temperature, and specimen condition. Details matter.
It compares stress amplitude with cycles completed before failure. Tests at several load levels reveal changing durability. A run-out marks planned testing without observed failure.
No. It supports performance only under the tested conditions and cycle count. Patients differ in weight, bone quality, movement, and surgical positioning. The conclusion needs restraint.
Define failure as fracture, visible cracking, excessive deformation, or a measured stiffness drop. Use one clear rule, or explain each rule separately. Ambiguity weakens comparison.
Examine stiffness loss, permanent deformation, displacement changes, and fracture surfaces. Look for crack origins, direction, fretting, and scratches. A tiny scratch can matter.
Include calibration records, dimensions, material condition, alignment, frequency, environment, and acceptance criteria. Preserve original machine files for independent review. A perfect graph deserves checking.
Damage near a gripping area may come from fixture influence, not the implant design. Damage near a connection may indicate a design concern. Sometimes, the explanation remains uncertain.
Testing orthopedic implants for fatigue resistance is essential because these devices must withstand repeated loads throughout daily activities without cracking, loosening, or losing structural stability. Why do orthopedic implants need fatigue resistance testing? The results help determine whether an implant can safely perform under realistic, long-term physiological conditions and reveal weaknesses before clinical use. A reliable evaluation begins by defining the expected fatigue behavior and selecting suitable test standards, load ranges, frequencies, and cycle counts that represent the intended anatomical application.
The test setup should include properly prepared implants, secure fixtures, and a simulated body environment that reflects relevant temperature, moisture, and contact conditions. During cyclic loading, researchers monitor displacement, stiffness, surface damage, crack formation, and final failure behavior. After testing, the data are analyzed to identify fatigue life, failure modes, load tolerance, and performance trends across specimens. Clear reporting should describe the methods, environmental conditions, number of cycles, observed failures, and limitations, allowing the implant’s durability and safety margin to be assessed consistently.

XOVEC Orthopedic Implants